
An Adaptive Economic Model for Pandemics
Author: Josh Patterson
Date: April 27th, 2020
Introduction
In this article we present the following thesis:
- Currently due to uncertainty and existential fear, consumer confidence has plummeted and the United States has entered a period of economic recession
- To avoid accelerating economic decline, we need to optimize our regional operations such that we maximize our GDP output while keeping the load on our healthcare systems to a manageable level
- The next 12-18 months are shrouded in a cloud of uncertaintity and we will likely be dealing with covid-19 infections that sporadically re-occur for an indefinite period of time
In our last report we analyzed the shelter-in-place effects for Tennessee and Hamilton County. In this report we build further on the concepts surfaced in the "shelter-in-place" analysis to support the dynamics of a model such as AEMP.
Until we have better data, it would be unwise to ignore the potential of a Covid-19 wave overwhelming our healthcare systems. As our data gets more accurate, we should update our operational model dynamically. We can't afford to "hide indefinitely" economically, but we also can't push forward blindly either. A framework like AEMP may give us the best of both worlds.
Disclaimers
This report was created by Patterson Consulting as an informational analytical exercise. No healthcare bodies nor goverments are endorsing this report.
Covid-19 and the Economic Dilemma
We can observe in economic data that shopping and spending patterns began to change in the 10-20 days leading up to when most businesses were ordered to shutdown. In the graph below (Via OpenTable), we can see how restaurant reservations began to decline in 37 states on average 73% over around 18 days before the state actually ordered shelter-in-place.
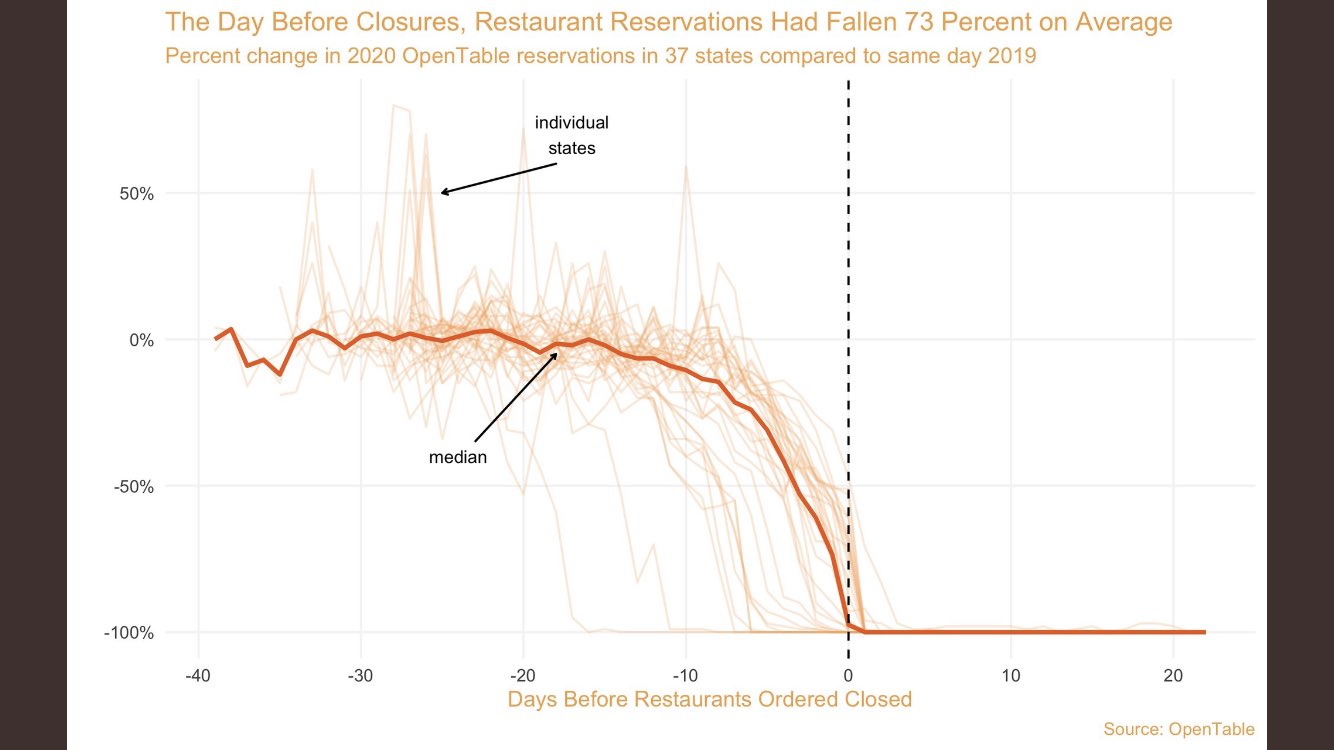
Reduction of consumer confidence as shown by OpenTable's data.
For 5 consecutive weeks starting in early April, the United States has reported over 3 million unemployment claims per week. This puts the real unemployment rate in the range of 20% with a total reported job loss of 26.5 million.
In the same timespan, 50,000 people have died in the United States from the Covid-19. Here I make the correlation that as the death rate climbed in April, consumer confidence fell and people stopped buying goods and services in tradition brick and mortar ways (as indicated by stores such as GAP stopping paying rent in April 2020). Consumers did not find an activity such as "retail shopping" or "going out to eat" worth the risk of potentially catching the virus and possibly infecting their family.
At the same time, States and Counties saw the potential for a compounding daily growth rate of infections to overwhelm their local hospital systems. The prospect of such an outcome prompted most states in the United States to issue "shelter-in-place" directives to slow down the infection rate.
However, by the time the shelter-in-place directives had been ordered in each state, consumer confidence had already fallen to significantly low levels. Consumers had already "shut down" some types of business with as a function of their existential fear, as we can see in the OpenTable graph above.
In our present situation, rising infection rates tend to generate fear, and fear tends to reduce consumer confidence. Lower consumer confidence drives a downward trend in business revenue, leading to more unemployment.
Staying in this cycle has the potential to accelerate further economic decline, and in this way Covid-19 has created a non-trivial economic dilemma. The counter-balance to this economic need is that we only have so many resources available in our healthcare system.
Hospitals are Not Limitless Resources
Most hospitals cannot sustain financially treating Covid-19 patients alone. This aspect of the pandemic challenge makes the response even more complicated.
Some hospital dynamics we need to consider:
- The burden of the uninsured: some hospitals do more than $100MM in uninsured care (cost, not charges) and the number grows dramatically every year.
- The underinsured: Some patients, while insured, have insurances (think Medicaid) that don’t pay enough to cover the cost of their care.
- Cost shifting: some services are undervalued by CMS and the insurance companies. Like taking care of medically complex elderly patients. Others are overvalued. Think complex procedures like heart surgery. Hospitals survive by doing a lot of the overvalued stuff and hoping they don’t have to do much of the undervalued stuff.
Given that we our timeline is uncertain for a vaccine, any economic operational strategy going forward needs to consider the operational limit for their regional healthcare system. We cannot bankrupt hospitals in the course of trying to restart our economy, so this is another facet of the problem to balance.
The Next 12-18 Months will be Uncertain
We need ways to rebuild consumer confidence but there will likely prove to be challenging. Consumers need to feel like they can safely enter a restaurant or get a haircut, and not endanger their families. Ideally a vaccine would be the best way to achieve this goal, but per Morgan Stanley analysts (graph below), it could be at least 12 months before a vaccine is widely available.
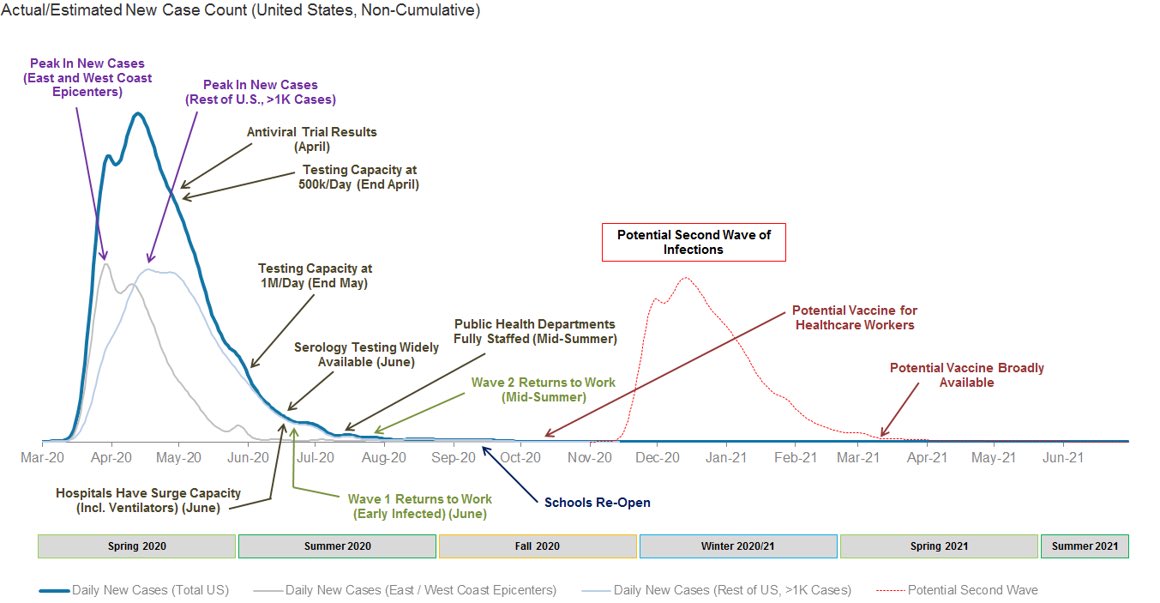
18 month timeline as compiled by Morgan Stanley (source).
The Yale Tobin Center of Economic Policy wrote about the challege of the next 12-18 months:
"The US faces an extremely challenging 12 to 18 months ahead before a vaccine is developed. The central challenge of this moment is to plan for, fund, and execute a safe reopening of economic and social life before a vaccine is released."
Dr. Eric Feigl-Ding (Epidemiologist and Harvard Chan School of Public Health, and a Senior Fellow at the Federation of American Scientists in Washington DC) further echoes a similar sentiment about a covid-19 vaccine timeline:
If vaccine truly isn’t arriving for 12 months, we will be in this pandemic mitigation/containment/reopening/resurgence purgatory for a long time. #COVID19 https://t.co/w6RidxmCsn
— Eric Feigl-Ding (@DrEricDing) April 14, 2020
Without a near-term solution to assure consumers, we are now in uncertain territory. Businesses are used to being prepared for an "economic downtown", but few businesses have a "pandemic playbook".
An Infection that is Difficult to Contain
Singapore seemed to have their containment strategy locked-in yet has recently seen spikes of infections in more recent days with the need to dial their restrictions up and down progressively.
"Singapore, too, expects to go back and forth between different levels of restrictions, Lee said during the webinar, which might be the most sustainable strategy in the long run. Minimally intrusive policies, such as encouraging personal hygiene and telecommuting, are relatively easy to keep up, he noted, but it’s harder to limit the size of gatherings, cancel entertainment, and close schools and businesses for very long. Experts in both cities believe setbacks are inevitable, as Singapore just learned. It reported 287 new cases on Thursday, its highest ever 1-day total. (Friday’s tally was 198; Saturday’s was 191.)"
"Singapore had a model coronavirus response, then cases spiked. What happened?"
We see a similar situation in Japan where one of their islands (Hokkaido) lifted their lockdowns too soon and a second wave of infections hit even harder. Twenty-six days later, the island had no choice but to implement another lockdown.
Scott Gottlieb (the former FDA commissioner) doesn’t think the US is going to return to normal anytime soon:
"As long as this pathogen is circulating in the background and we don’t have a vaccine and very effective therapeutics, this is going to alter the way we live and do business. Some of it is going to be subtle. You’ll see businesses advertising deep cleanings. People aren’t going to shake hands as much anymore. Wearing masks in public is going to become more fashionable in Western societies. Some of it’s going to be more profound. I don’t think the marginal customer for a stadium or a concert or a cruise ship is coming back soon. I think people are going to be more circumspect about travel, particularly international travel. Businesses are going to be more circumspect about bringing together large groups of people. So you’re going to see a change in the way we live, in the way we do business. The question is: Can we get back to our normal level of economic activity with that kind of profound, pervasive change in the way we operate? It may be hard. That’s why I talk about the “80 percent economy.”
We are dealing with uncertaintity because data is only now emerging on the Covid-19 virus and how it is transmitted; The Russians went as far to call predicting the end of their lockdown a "shot in the dark".
We Need More Data on Covid-19 to Better Understand How to Deal With It
Right now many parts of the country have less information on the local Covid-19 population than is ideal. This lack of data creates further uncertaintity around the current state of the infection, further driving down public confidence.
The Duke Margolis Center for Health put out guidelines for managing data collection in their published document "A National COVID-19 Surveillance System: Achieving Containment". They go on to state: "Every region of the country should aim for the following outbreak surveillance and response capabilities:"
- Test and Trace Infrastructure: Capacity for Widespread Diagnostic Testing and Data Sharing to Enable Rapid Case-Based Interventions
- Syndromic Surveillance: Integration of Test and Trace into an Enhanced National Syndromic Surveillance System
- Serologic Testing: Capacity to Conduct Widespread Serologic Testing to Identify Reliable Markers of Immunity
- Rapid Response: Capacity for Isolation, Contact Tracing, and Quarantine
Ideally we'll see these methods in full practice somewhere on the above timeline. However, it may take some time for every county's health department to get the above infrastructure in place and operational. Over time, as the above methods come online, we will get a much better picture of what is happening in our communities around the true infection, hospitalization, and mortality rates for Covid-19. As more data comes online, the hospitalization and mortality rates will likely be re-adjusted down. However, there are no guarantees of that, and until we have the true data we will have to work with the data that we have.

The current state of Covid-19 testing in the United States (as graphed by The Covid-19 Tracking Project).
More accurate data gives us a more complete picture of what we're dealing with in the Covid-19 pandemic. One report recently from the CDC documented the epidemiology of a coronavirus disease (COVID-19) outbreak in a call center in South Korea. Another recent report sheds light on the "Effectiveness of isolation, testing, contact tracing and physical distancing on reducing transmission of SARS-CoV-2 in different settings".
"Of 1,143 persons who were tested for COVID-19, a total of 97 (8.5%, 95% CI 7.0%–10.3%) had confirmed cases. Of these, 94 were working in an 11th-floor call center with 216 employees, translating to an attack rate of 43.5% (95% CI 36.9%–50.4%). The household secondary attack rate among symptomatic case-patients was 16.2% (95% CI 11.6%– 22.0%). Of the 97 persons with confirmed COVID-19, only 4 (1.9%) remained asymptomatic within 14 days of quarantine, and none of their household contacts acquired secondary infections."
CDC: "Coronavirus Disease Outbreak in Call Center, South Korea"
Early on in this pandemic, we've only begun to get a basic understanding of specifically how Covid-19 is trasmitted in different spaces. As we deploy more testing infrastructure, more analysis for specific situations in how our economy operates will be documented. Once we better understand how to operate with the virus in the environment, this will tend to drive more "safe" interactions and give the public more confidence.
The asymptomatic covid-19 population provides an unusual challenge in dealing with the pandemic as the the true number of infected people can non-trivially change the denominator for the hospitalization and death rates. The New England Journal of Medicine recently reported the following data in the quote below.
"Nasopharyngeal swabs were obtained from 210 of the 211 women (99.5%) who did not have symptoms of Covid-19; of these women, 29 (13.7%) were positive for SARS-CoV-2. Thus, 29 of the 33 patients who were positive for SARS-CoV-2 at admission (87.9%) had no symptoms of Covid-19 at presentation."
The New England Journal of Medicine: "Universal Screening for SARS-CoV-2 in Women Admitted for Delivery"
Better understanding of things such as "how to operate in our business environments" in the context of how many asymptomatic carriers are likely around will change how we interact with our surroundings. However, this change is necesary so that people can regain some normalcy in their day to day lives and begin to bring consumer confidence back up, driving economic output.
We can see that our economy is in decline if we stay home but we fear getting sick, so we don't want to go anywhere. We have to operate under a "Cloud of Uncertaintity" for at least the next 12 months. We know its possible to operate in this new environment, but its going to take a while to get all the infrastructure in place to track the virus.
What if We Just Treat it Like the Flu?
To illustrate how significant a Covid-19 wave of illness could be, let's look at a scenario. It has been suggested that we treat Covid-19 as we would the seasonal flu.
A mild flu season infects 7.4% of the population and currently the state of Tennessee has 6,770,010 residents. If we use the currently known Covid-19 Tennessee hospitalization rate of 12% (if that holds), this would produce a 500,981 hospitalizations across a 5 month season hypothetical covid-19 season.
For comparison, the 2018-2019 flu season in the United States was estimated by the CDC to affect 35,500,000 people across all states. It was estimated to have infected 10.8% of the population, with a hospitalization rate of 1.38%. This hospitalization rate produced 490,561 flu-related hospitalizations across all states in the United States. Comparatively, the state of Tennessee would have more hospitalizations for Covid-19 than the entire United States flu season in 2018.
Summary: until we have better data, it would be unwise to ignore the potential of a Covid-19 wave overwhelming our healthcare systems. As our data gets more accurate, we should update our operational model dynamically.
Adaptive Economic Model for Pandemics (AEMP)
Let's review the key points from the article so far:
- consumer confidence is low due to existential fear over covid-19
- caution over pandemic drives activity reduction orders, such as shelter-in-place
- both combined create non-trivial drop in revenue, producing large-scale unemployment
- shelter-in-place creates drop in compounding growth rate of Covid-19 infections
- hospitals are not limitless resources
- we cannot stay in our current economic trajectory without dire negative effects
- we have to operate in the near term under a certain level of uncertaintity (e.g., "when will a vaccine be produced?")
We don’t know how long the current conditions will last and forecasting regional Covid-19 impact has been a moving target so far. We will likely get county-level spikes of infections periodically over the next 18 months.
We propose operating the state of Tennessee on a per-county basis with an Adaptive Economic Model for Pandemics (AEMP).
AEMP Model Dynamics
In the AEMP model we would see:
- Only shutdown a county if the county has an infection daily CDGR that will exceed the number of usable Covid-19 beds in the next 14 days (this threshold visualized further below)
- Counties that continue to have low infection rates will continue to operate and drive economic activity
- Counties will have to adapt their workplace operational hygiene practices (masks, washing, etc)
- Maximize the GDP output per county that is possible under Pandemic conditions
- Minimize the operational impact to critical healthcare providers
However, there were at least 10 counties that saw a non-trivial drop in covid-19 CDGR. This drop in growth rate reduced the acceleration of infection in this counties, which prevented more hospital strain and potential extra fatalities.
The top 6 counties in Tennessee account for 62.8% of the GDP output. Two of the top 6 (Memphis, Nashville) have the most Covid19 population count growth from 4/1 to 4/16. Counties such as Hamilton County have driven their infection rate growth down to 1.1 CDGR. Each county has a different story to consider and different circumstances.
With the AEMP model we can seperate the dynamics of the two types of counties in Tennessee (or any state/region), and tailor each county's economic rate to run at a level of infection that their healthcare system can sustain --- or a level they choose is most morally responsible. Ideally the end result is a model where we maximize our per-county GDP while at the same time keeping our Covid-19 population at a level that can be sustained by our regional healthcare system. We'll also note that during the Spanish-Flu there were also changes in city operations as well.
Yeah, But What If....
What if we never see a mass of infections and Covid-19 was just all a big hoax and we massively overstated the danger?
Then AEMP would never trigger an alarm, and our economy would naturally come back online as we quickly got back to normal.
What if we restart all of our businesses in earnest, with the best of intentions (e.g., "people have to feed their families"), and the infection rate begins to accelerate out of control?
Likely the bottom 70 counties in Tennessee are too sparse with respect to population and would not see this. However, the top 10 most dense counties could be at risk of this (as shown in the previous article). In this scenario, the rural counties would not see reduced operational levels, but the top 10 more urban areas would periodically trigger AEMP thresholds and be downshifted into lower operational levels to mitigrate infection growth levels.
If AEMP worked as intended, we'd do the best we could economically through this period of uncertaintity until we got a covid-19 vaccine.
Summary: We can't afford to "hide indefinitely" economically, but we also can't push forward blindly either. A framework like AEMP may give us the best of both worlds.
State-Level Rules Make Less Sense Than County-Specific Rules Given Observed County Dynamics
A model published in the Economist (shown in the image below) forecasted that regions with lower medical resources and older concentrations of populations would be disproportionately affected by Covid-19.
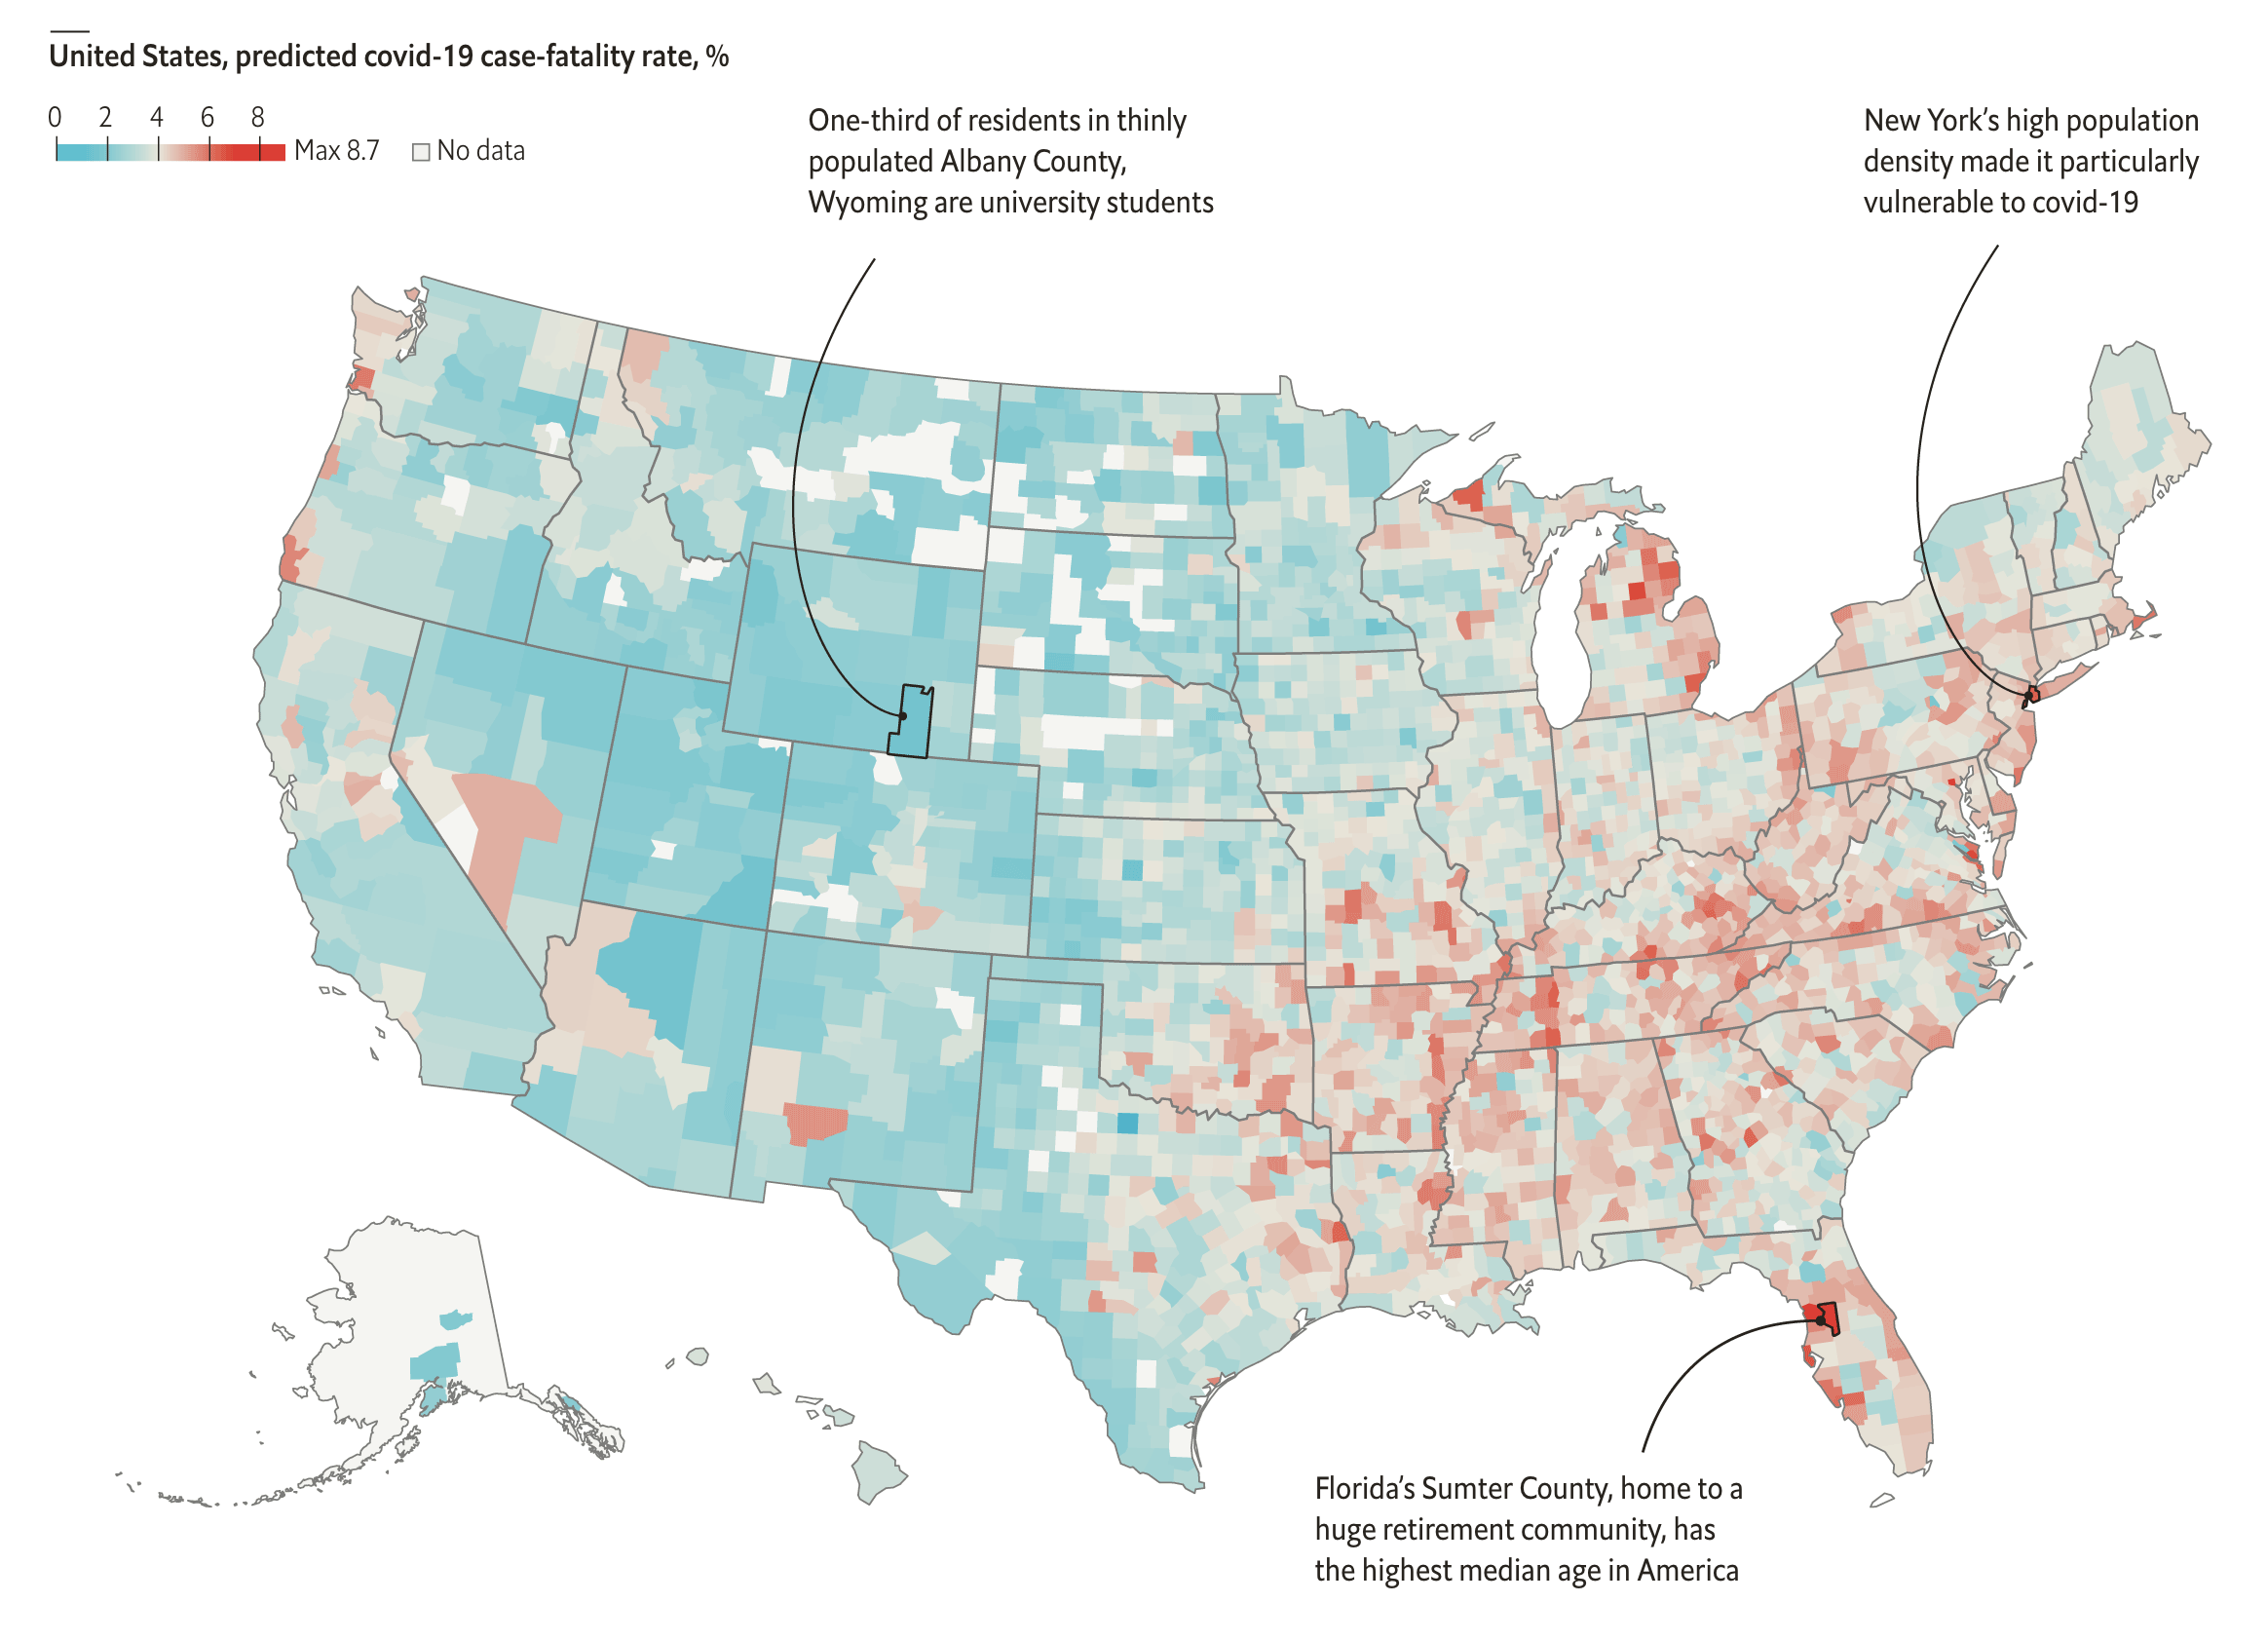
Graph from the Economist article "The South is likely to have America’s highest death rate from covid-19".
This model further supports the idea that Covid-19 will affect our communities at a more granular level and that we may need to look at building plans not at the state-level but on a per-county basis.
Understanding the Forecasting and Thresholding of the AEMP Model
In the AEMP Model each county should only operate at an infection CDGR level that will not outstrip its healthcare resources in any given time period.
Each hospital can only allocate so many beds to COVID-19 patients and they typically operate at 50% capacity. If we allocate the remaining 50% to covid-19 patients, this would be the limiting factor per county. For the sake of our example, let's assume Hamilton County decided that it's healthcare system could allocate 200 beds to Covid-19 patients and still be financially viable (and this may include federal subsidies, etc).
If we want to maintain a 2-week horizon for visibility into how the near term infection growth rate is behaving, the AEMP model would daily compute the compounding growth numbers for new hospitalizations and then aggregate a rolling 14 day window of the new hospitalizations up to the present day.
The model then uses a rolling average of the daily compounding infection rate to compute/forecast the total infections for the county per day over a 14 day horizon. If we use the known hospitalization rate for the county, we can then compute cumulative hospitalitions and then additional hospitalizations per day over the same future 14 day window.
A Note About Forecasting Method
In this case we're assuming a simple forecast that generalizes that the infection growth rate will not change radically over a 14-day horizon; This is not based in an epidemilogy theory, yet just an observation in the data that the infection curves tend to move in trajectories that slowly change over hte course of multiple weeks or months.
This should be considered a simple analytical method to give a near-term 14-day "worst case" forecast in this context. There are likely more accurate ways do to this, but for the approximation of infection growth on a 14-day horizon window, it seems to be sufficient based on observed data.
Your mileage may vary, and you are free to email me and tell me how wrong I am with this method.
Finally the AEMP model checks to see if any day's 14-day hospitalization window in the future window exceeds the total available covid-19 beds in the county. If the any day has a total current forecasted hospitalizations that exceeds the covid-19 available bed count, then the AEMP system would trigger an alert. We can see the thresholding effect visualized in the image below.
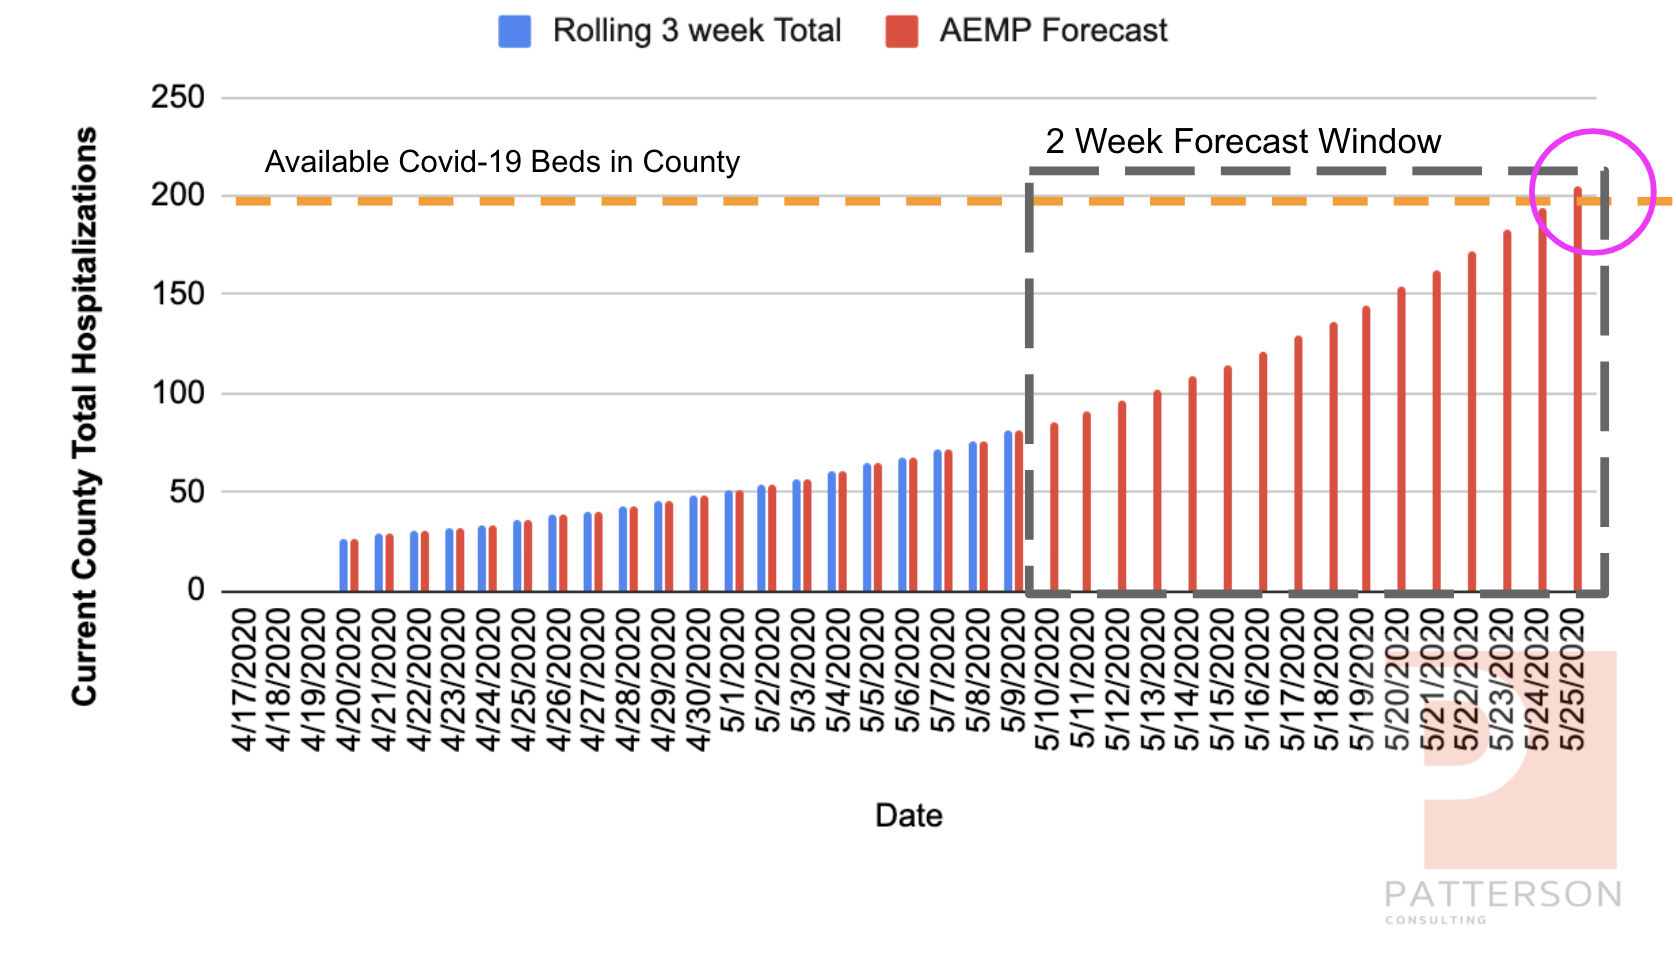
AEMP Forecast and Threshold, Visualized.
At this point (circle in the forecasted area in the diagram above), we'd consider our "resource horizon" to be "breached", and our "days of supplies" need to be re-evaluated. The county would have 2 options:
- Decelerate the infection growth rate; the county would be “down-shifted” into “cooldown mode” for a period of 14-21 days (to hopefully) lower the CDGR, a dynamic we observed in our analysis of Tennessee' shelter-in-place)
- Allocate further resources to the healthcare system (e.g., "open up temporary hospital bed housing")
This threshold and alert dynamic would allow each county to tailor their trigger mechanics and response methods in a framework tht allows them options to balance how they let their economny run while protecting their healthcare system. We use the metaphor here of "control rods in a nuclear reactor"; we know we need to sustain a controlled nuclear chain-reaction, yet we also need a way to slow down the reaction. The control rods allow a nuclear plant to do this and in this way, we compare actions such as "shelter in place" to be our current best method to "slow our infection 'reaction' down".
Scenario 1: Simulate May 2020 for Hamilton County, TN
Let's simulate a scenario to see how this might work in practice. Let's assume that as a county that Hamilton County collectively decided that being in shelter-in-place long-term was not worth the economic decline (as decribed previously) and we wanted to operate with a certain level of infection rate but "not too much". We decide to use the AEMP model on 4/24 and then watch it daily.
For this simulation we re-open everything in Hamilton County on 4/24 using the reported infection number of 133 (state website). We play out the simulation with the following assumptions:
- Our post-shelter-in-place CDGR is 0.06; we assume with more activity its going to be above 0.011, but below the original 0.11 (we got smarter), so we chose a number generally between them
- Let's assume we set the Hamilton County covid-19 bed ceiling at 200 beds
- We'll use the current Tennessee hospitalization rate of 12% (know that with more data, it will likely be lower, but we want to be safe)
In the simulation spreadsheet above, we can see AEMP calculating the future days in the grey area. In the graph below, we can see the actual (simulation) days as blue bars, and the AEMP forecast as red bars for 5/17/2020 through 6/1/2020.
As we can see in the graph above, the y-axis is set to a limit of 200 as we know this to be the maximum number of beds we can allocate before we begin to distress our county healthcare resources. Based on this simulation, AEMP tells us that while we're seeing a progressively higher hospitalization count, things are ok.
Scenario 2: Simulate May 2020 for Hamilton County, TN --- But Now With More Sick People
This time we'll run a similar simulation for Hamilton County but we'll start out the county with 500 infections as opposed to 133. Again, Hamilton County collectively decided that being in shelter-in-place long-term was not worth the economic decline (as decribed previously) and we wanted to operate with a certain level of infection rate but "not too much". We decide to use the AEMP model on 4/24 (with 500 infections this time) and then watch it daily.
For this simulation we re-open everything in Hamilton County on 4/24 using the reported infection number of 133 (state website). We play out the simulation with the following assumptions:
- Our post-shelter-in-place CDGR is 0.06; we assume with more activity its going to be above 0.011, but below the original 0.11 (we got smarter), so we chose a number generally between them
- Let's assume we set the Hamilton County covid-19 bed ceiling at 200 beds
- We'll use the current Tennessee hospitalization rate of 12% (know that with more data, it will likely be lower, but we want to be safe)
In the graph below, we can see the actual (simulation) days as blue bars, and the AEMP forecast as red bars for 5/17/2020 through 6/1/2020 similar to the last simulation.
As we can see in the graph above, the y-axis is set to a limit of 200 as we know this to be the maximum number of beds we can allocate before we begin to distress our county healthcare resources. The simulation reacts different this time because of the larger initial population of infected covid-19 patients; With the same CDGR we now see a community that breaches the resource horizon ceiling on 5/25/2020 as opposed to things "being ok".
In this scenario AEMP would give Hamilton County an alert 14 days before the resource ceiling was breached the the county leadership could make pragmatic decisions to either:
- decelerate the CDGR factor with a "shelter-in-place" order, or some other "reduced operations" method
- allocate more hospital beds for covid-19 patients
All Models are Wrong, Some are Useful
We close out this article on AEMP with the old saying in machine learning, "All Models are Wrong, Some Models are Useful" (this saying was coined by George E. P. Box and also applies to scientific models).
The AEMP model will not forecast a county's long-term covid-19 infection curve, nor is it intended to; The AEMP model framework is intended to:
Provide a general framework on how a balance between economics and healthcare can be achieved on a per-county granularity across an uncertain timeline.
Some counties and cities have already begun to implement systems that change "levels" based on infection rates. Those models are similar in concept to what we're proposing here. This article is meant as a discussion sounding board to help surface the "best of breed" concepts.
Further Ideas for AEMP Improvements
Some other ways we could potentially improve AEMP:
- An adaptive hospitalization rate --- as more data comes online, we continually re-calculate the hospitalization rate so that AEMP's 14 day horizon window is more accurately reflecting the data
- keep recording the actions of cities (e.g., "Nashville") that implement levels of operational changes (to mitigate infection growth); then use this data to build a statistical regression model to forecast how a county might affect their own CDGR with similar infection growth mitigation methods
Footnotes
Footnote: [TinyTermite]
TinyTermite: A Secure Routing Algorithm
- "TinyTermite: A Secure Routing Algorithm on Intel Mote 2 Sensor Network Platform", AAAI Publications, Twenty-First IAAI Conference
- Thesis